
Choose your investments carefully.
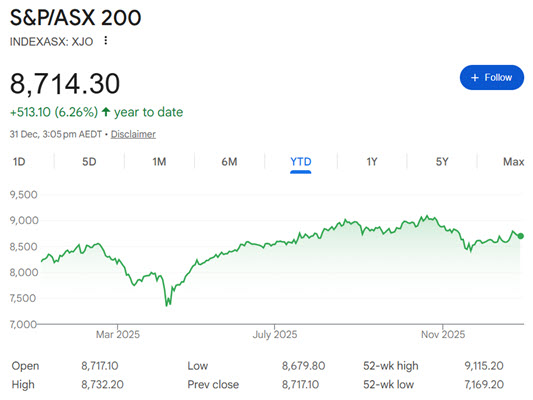
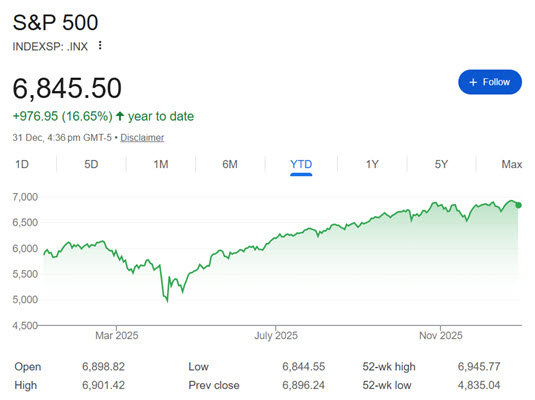
2025 produced the third double-digit growth year in a row, as long as you are looking at the US market, which produced a 16.6% gain. Not so for the ASX, which struggled to just 6.3%. This doesn’t tell the whole story however, as US dividends (averaging just 1.15%) are less than Australian (3.61%), closing the gap a little. Nonetheless, by world standards, as we have shown below, the ASX continues to underperform.
If you had invested $100k in an index fund for both markets three years ago, you’d have made $87k on the SP500, but only $38k on the ASX200, a difference of almost $50k. If your balance was half a million, as many do, you’d have left nearly a quarter of a million dollars on the table, just by being loyal to the local market and the so-called Aussie blue chips. With such significant differences in financial performance, the lazy option of entrusting one’s super fund to either the default settings, or to whatever allocations were made a decade or more ago can be a significant impact on retirement lifestyle options.
Do you know how and where your superannuation funds are invested? How long since you’ve compared the annual returns with the various international markets?
Comparison of US and AUS Markets – 2025
For starters, here are the 2025 Sharemarket performances for the ASX and the US market, according the SP500 index. While the US markets finished near record highs, the Australian Market fell significantly after a late-year high. We will look at other markets further below.
The lesson one might take from this significant difference in investment outcomes is that there has been a considerable cost in keeping a significant part of one’s portfolio in the Australian market.
Why is this?
- The Australian Sharemarket does not have big profit-generating companies with global markets, economies of scale, and blue-sky opportunities.
- The ASX200 has finished the year below the value of 22 July 2025 – there have been no nett gains for over 5 months!
- Inflation has remained on the high side of RBA targets, leading now to expectations that the next interest rate movement may well be up not down. This is a headwind to equity values.
- Sectors like healthcare that led a bullish run in early 2026 retreated in the second half of the year.
- Technology stocks were varied and volatile, suggesting their performance was subject to business not market influence. Life360 Inc for example was up 145% in August, only to fall back to a (still significant) annual gain of $48%. Technology One Ltd (down 10%) and WiseTech Global (-41%) were the most negative.
- Earnings downgrades on commodities from resource giants held the market back, despite some late year modest recoveries.
- Global factors – tarifs, geopolitical uncertainty (Russia / Ukraine, China / Taiwan, Israel / Palestine, Sudan Civil War, Syrian Civil War and conflict in Myanmar ), concerns of a US Tech stock bubble and US government policy volatility all contributed in a negative manner.
Basically, there is not a lot of good news afloat!
So, how do these figures compare globally for 2025?
Here is a privately curated list of the top 20 indexes, ranked by Total Return, which includes dividends. Unlike previous years, the US SP500 is well down the list at position 15 this year, as various Asian, European and World indexes have had significant returns. Imagine being fully invested in the Australian market and seeing this, with the ASZ near the bottom of the top 20 list!
| Rank | Index | Region / Type | Raw Return 2025 (%) | Total Return 2025 (%) |
|---|---|---|---|---|
| 1 | KOSPI | South Korea | 75.60% | 76% |
| 2 | Brazil Bovespa (Ibovespa) | Brazil | 31 34 % | 33.50% |
| 3 | MSCI Emerging Markets | Global EM | 30 33 % | 32.50% |
| 4 | Hang Seng Index | Hong Kong | 30.60% | 31% |
| 5 | MSCI World ex-USA | Global ex-US | 26 32 % | 30% |
| 6 | TSX Composite | Canada | 28 29 % | 29.50% |
| 7 | Nikkei 225 / TOPIX | Japan | 26 29 % | 28.50% |
| 8 | DAX 40 | Germany | 22 23 % | 23.50% |
| 9 | FTSE 100 | UK | 21.5 21.6 % | 22.50% |
| 10 | MSCI World | Global Developed | 20 21 % | 21.50% |
| 11 | NASDAQ Composite | USA (tech) | 20 21 % | 21.50% |
| 12 | MSCI All Country World (ACWI) | Global All | 20 21 % | 21.50% |
| 13 | Euro Stoxx 50 | Eurozone | 18 20 % | 20% |
| 14 | Shanghai Composite | China | 18 19 % | 19.50% |
| 15 | S&P 500 | USA | 16.4 17.8 % | 18.50% |
| 16 | Dow Jones Industrial Average | USA | 13% | 14.50% |
| 17 | Russell 2000 | USA small caps | 11 13 % | 13% |
| 18 | ASX 200 | Australia | 6.80% | 11.40% |
| 19 | Nifty 50 | India | 8 9 % | 9.50% |
| 20 | Sensex (BSE) | India | 5 6 % | 6.50% |
What does the ASX at #18 mean?
The lesson we wish to share? Don’t trust your super fund allocations to the fund manager who will likely default members into a safe middle-of-the-road approach, which no doubt will be heavy with underforming Australian shares. Yes, your capital will likely be safe, but the risk of under-performance is significant and costly. Be involved! There is a whole world of investment opportunities and the Australian market’s return remains at the bottom of the heap, even with the superior dividend returns. You may have noticed recent advertising on social media promoting high-dividend stocks? We advise great caution if these ads are of interest to you – a healthy dividend is costly if it means sacrificing significant capital gains.
Further, tax must be paid on dividends in the year they are paid. Capital gains are generally deferred until retirement, which are free of capital gains tax in the retirement / pension phase. So a focus on dividend stocks in superannuation accumulation phase has tax implications, further reducing it’s attractiveness.
Conclusion
The world provides numerous investment markets. Limiting oneself to just their local market is probably going to lead to sub-optimal results. Not knowing where one’s superannuation funds are invested is also likely to provide poor outcomes. Get curious, get educated, get involved!